4 Prompts That Turn Any CSV Into an Excel Dashboard (Claude in Excel Tutorial)
Try Text
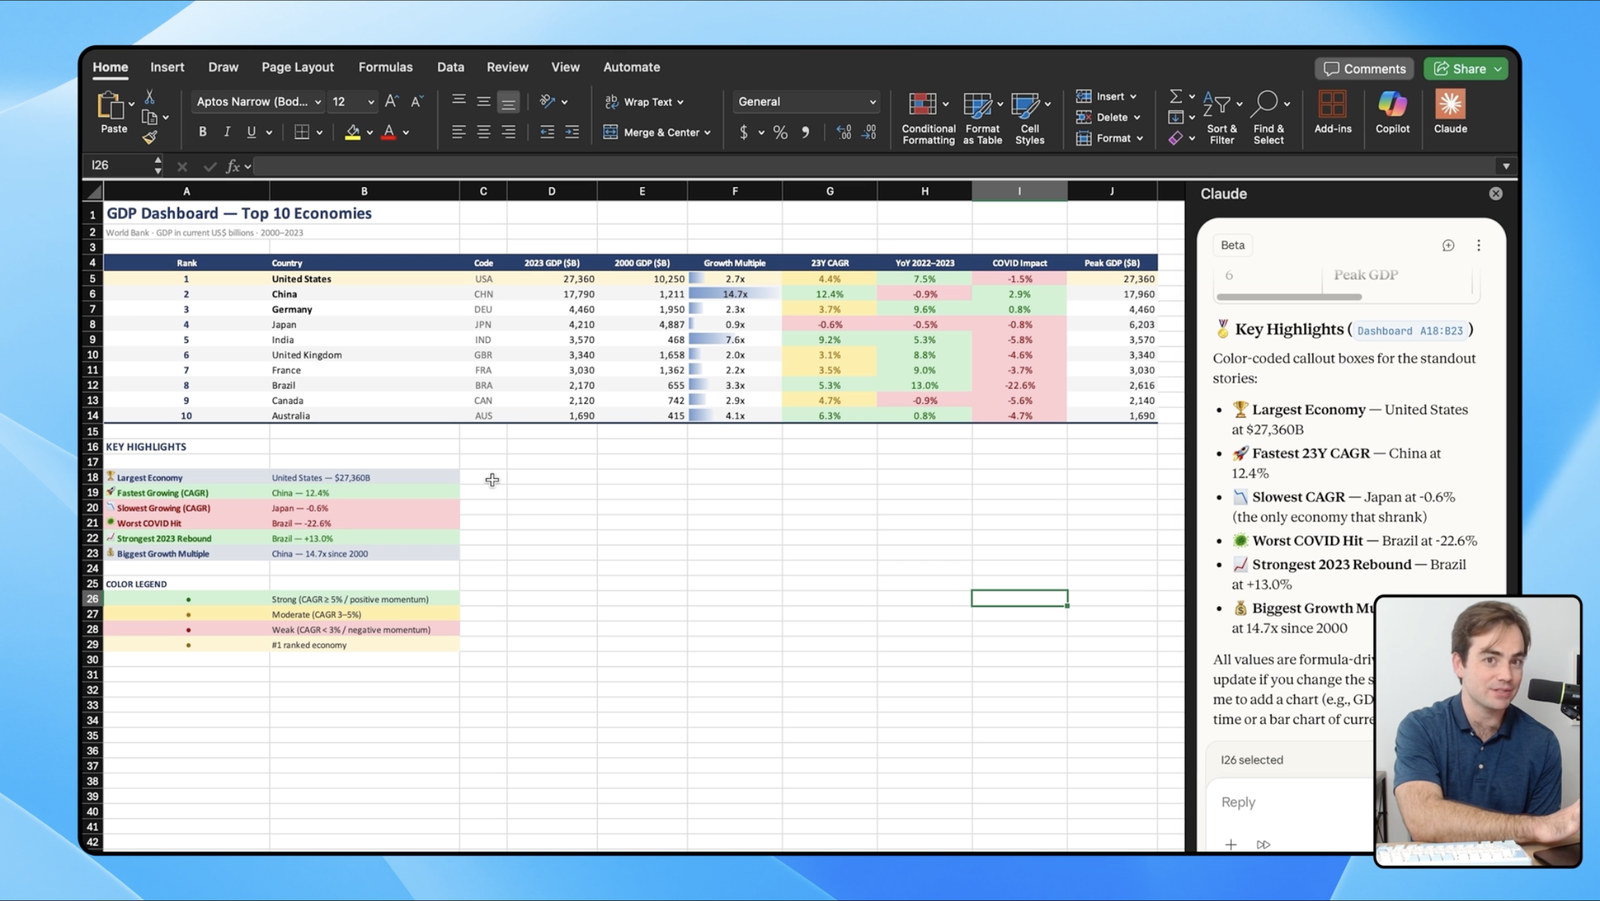
Learn four copy-paste prompts that turn a raw CSV into a clean, visual Excel dashboard using Claude in Excel. You will import a dataset, have Claude inspect and clean it, then generate summary tables, conditional formatting, and charts. The cleaning pass can take a minute or two depending on the data, and the dashboard-building step takes about five minutes.

Save 15% on Thoughtly by joining The Runway University
Through our vast network of over 100 partnerships with major AI companies, we also offer University members free access or major discounts to the many popular AI tools along with AI certified courses, daily guides on AI tools and many more.
Tools


AI training for the future of work.
Get access to all our AI courses, hundreds of real-world AI use cases, live expert-led workshops, an exclusive network of AI early adopters, and more.